Debugging with NetBeans IDE
Have you ever encountered errors in PHP code? Which debugging program did you use in such case? If you still do not have such program, it is time to learn about NetBeans IDE!
It is necessary to add these lines to php.ini:
	zend_extension_ts="/usr/local/php5/php_xdebug-2.0.4-5.2.8.dll"
	xdebug.remote_enable=on
	xdebug.remote_host=127.0.0.1
	xdebug.remote_port=9000
xdebug.remote_handler=dbgp
Note: How to find the file php.ini on your computer? Here it is explained how to do this.
After the installation it is necessary to create the new project for debugging and to specify the path to your resource:

When you created the new project, it is possible to:
-
- Open the project in the browser:

- Open the project in the new window of the browser for debugging:

- Open the project in the browser:
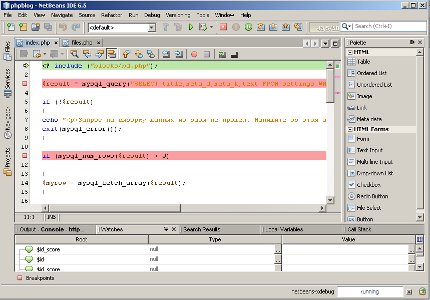
When you open the project for debugging in the browser, you’ll see a message:
Launching. Please wait…
It means that single-step debugging has started. Use NetBeans for debugging!
